
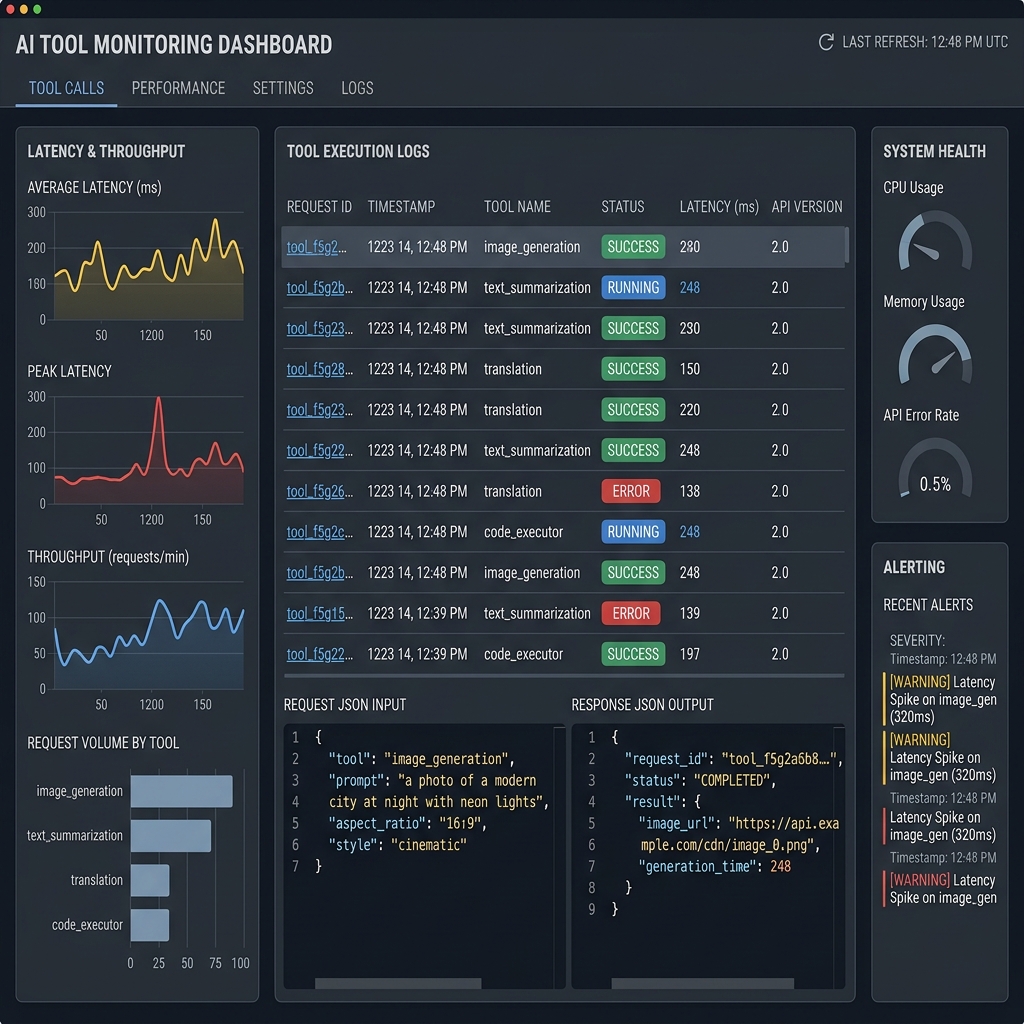
Tool Calling Dashboard
A developer-focused dashboard for observing and debugging AI tool calls in real-time. It provides a visual trace of every call, including latency, input parameters, and raw model outputs.
Core Capabilities
Every starter is pre-configured with industry best practices and deep AINative integrations. Clean, modular, and designed to scale from prototype to production.
Real-time call tracing
Enterprise-ready implementation with full type safety and observability. Optimized for high-throughput streaming and minimal latency.
Visual tool editor
Optimized for Edge runtimes and serverless environments.
Input/Output validation
Secure by default with built-in validation and CSRF protection.
Replay failed calls
Deep integration with the AINative Reconciler state system for buttery smooth UI updates and zero-flicker streaming.
Technical Stack
Clean, modular, and designed to scale from prototype to production.
Frontend Layer
Reactive hooks and streaming primitives.
import { ToolDashboard } from "@ainative/observability";

export function AdminTools() {
  return <ToolDashboard project="production-chat" />;
}
Backend Adapter
Universal protocol handlers for any runtime.
import { ToolTracker } from "@ainative/observability-node";

// Wrap your handler to enable tracing
export const POST = ToolTracker(createAINativeHandler({
  provider: "openai",
  tools: myTools
}));